State in Decline, Employment in RI Cities and Towns: Providence
It would be possible to present Providence’s employment picture in a variety of ways, depending on what one wishes to argue. Of course, the city’s 13.5% unemployment rate, not seasonally adjusted, is horrible, even in comparison with Rhode Island’s overall 11.8%.
Still, much of that employment gap results from growth in the labor force that wasn’t matched by growth in employment, meaning that more people are looking for work but are unable to find it. From 2000 to 2010, Providence’s population grew 2.5%, and its labor force expanded 8.3%. But the number of employed residents slid by 1.8%.

The problem for Providence, as those columns show, is that a relatively small percentage of its population is either working or looking for work. In fact, in 2010, only around 40% of the city’s residents had jobs, down from around 42% in 2000. Only about another 6% of residents were looking for work. Of the cities and towns that the Current has reviewed, only Central Falls has lower numbers.
If Providence’s labor force participation rate were more in line with the states, say at around 55% of residents, its March unemployment rate would have been 29.2%.
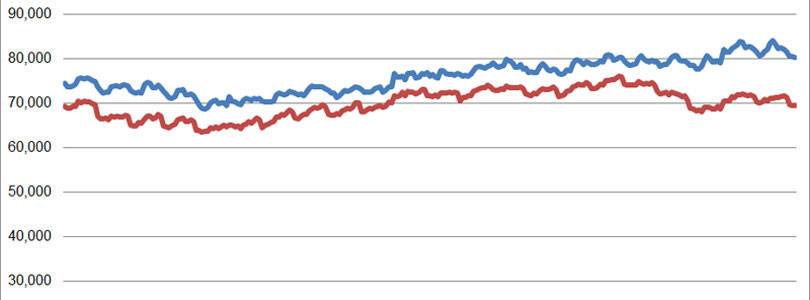
As the following chart shows, however, the city’s number of employed residents has achieved a sort of bumpy stabilization, although the trend is currently downward. Nonetheless, recent improvements in the unemployment rate result from the fact that fewer people are looking for work, rather than more people finding it. Unemployment is represented as the gap between the two lines.

Note on the Data
The population data above comes from the U.S. Census conducted every ten years and is therefore generally considered reliable, to the extent that is used as reference for various government programs and voter districting.
The labor force and unemployment data, however, derives from the New England City and Town Areas (NECTAS) segment of the Local Area Unemployment Statistics (LAUS) of the federal Bureau of Labor Statistics (BLS). A detailed summary of the methodology is not readily available, but in basic terms, it is a model based on and benchmarked to several public surveys. It can be assumed that the sample rate (i.e., the number of people actually surveyed) in each Rhode Island town is very small (averaging roughly 30 people per municipality).
The trends shown, it must be emphasized, are most appropriately seen as trends in the model that generally relate to what’s actually happening among the population but are not an immediate reflection of it. Taking action on the assumption that the exact number of employed or unemployed residents shown corresponds directly to real people in a town would vest much too much confidence in the model’s accuracy.
Be that as it may, the data has been collected and published, and taken a town at a time, it is relatively easy to digest. So, curiosity leads the Current to see it as the best available data to deepen our understanding of trends within Rhode Island. If the findings comport with readers’ sense of how the towns relate to each other, perhaps lessons regarding local and statewide policies may be drawn. If not, then the lesson will be on the limitations of data in our era of information overload.


