State in Decline, Employment in RI Cities and Towns: New Shoreham
Probably the most useful lesson from unemployment information for New Shoreham is about the data itself: With such a small population (1,051 in 2010), the data oscillates wildly, and one gets impossible results, such as an average labor force, in 2010, that was greater than the population.
Still, if trends can to some degree be captured, New Shoreham expanded over the course of the last decade, with population up 4.1%, labor force up 11.5%, and employment up 4.6%.

Not surprisingly, for a town that covers Block Island, New Shoreham’s employment situation is highly seasonal. However, this winter appears to have been especially bad, with unemployment reaching 32.0%, in February, for the first time since January 1994, improving only to 29.5% in March. (Percentages are not seasonally adjusted.)
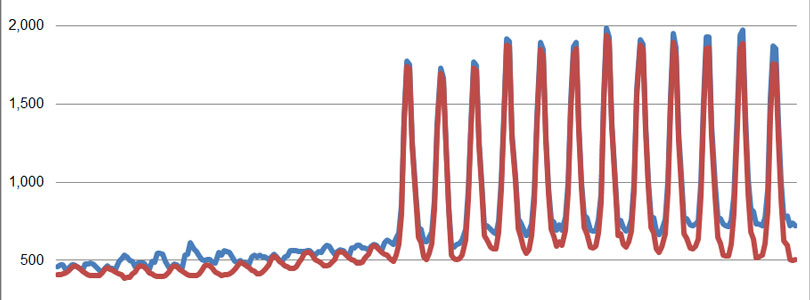
In the following chart, unemployment is represented by the space between the two lines. More notable is that the seasonal trend is so strong that the town goes from near total employment in the summer to very high unemployment in the winter.
However, the number of months of lower unemployment have been decreasing, down to only four, last year. They’ve also been less active. Last August’s unemployment rate, for example, was 5.6%. The peak month hasn’t been that high since 1994.

As can also be seen in the data for Middletown and Newport, the U.S. Bureau of Labor Statistics appears to have made some change around the year 2000 that affected locations prone to seasonal shifts. However, on Aquidneck Island the change smoothed the numbers, whereas on Block Island, it exacerbated the swings.
Note on the Data
The population data above comes from the U.S. Census conducted every ten years and is therefore generally considered reliable, to the extent that is used as reference for various government programs and voter districting.
The labor force and unemployment data, however, derives from the New England City and Town Areas (NECTAS) segment of the Local Area Unemployment Statistics (LAUS) of the federal Bureau of Labor Statistics (BLS). A detailed summary of the methodology is not readily available, but in basic terms, it is a model based on and benchmarked to several public surveys. It can be assumed that the sample rate (i.e., the number of people actually surveyed) in each Rhode Island town is very small (averaging roughly 30 people per municipality).
The trends shown, it must be emphasized, are most appropriately seen as trends in the model that generally relate to what’s actually happening among the population but are not an immediate reflection of it. Taking action on the assumption that the exact number of employed or unemployed residents shown corresponds directly to real people in a town would vest much too much confidence in the model’s accuracy.
Be that as it may, the data has been collected and published, and taken a town at a time, it is relatively easy to digest. So, curiosity leads the Current to see it as the best available data to deepen our understanding of trends within Rhode Island. If the findings comport with readers’ sense of how the towns relate to each other, perhaps lessons regarding local and statewide policies may be drawn. If not, then the lesson will be on the limitations of data in our era of information overload.


