State in Decline, Employment in RI Cities and Towns: Newport
Like its Aquidneck Island neighbor, Middletown, Newport’s unemployment rate is high compared with the rest of the state, and the changes in its employment statistics from one U.S. Census to the next were dramatic.
For March 2012, Newport’s not-seasonally-adjusted unemployment rate was 12.4% (to the state’s 11.8%). It’s important to keep in mind that both Newport and Middletown tend to see significant fluctuation, from summer to winter, but not only has summer unemployment increased, but the winter downturns have become brutal.
However, the seasons don’t affect the long-term trend data, because the RI Department of Labor and Training provides averages for the year. On that count, from 2000 to 2010, the city’s population fell 6.8%; its total labor force (working and looking for work) fell 3.4%; and the total number of employed residents fell 10.2%. The Current’s review of this data has thus far only covered Bristol, Kent, and Newport counties, but among those, only Middletown has seen a greater decline.

If there is a silver lining for Newport, it’s that none of its March 2012 data is at all-time highs or lows, as is the case in some other cities and towns. That said, Newport’s total labor force is above the twenty-two year average, while its total employment is below. That results in a number of unemployed residents that is within 20% of the all-time high set in January 2011.
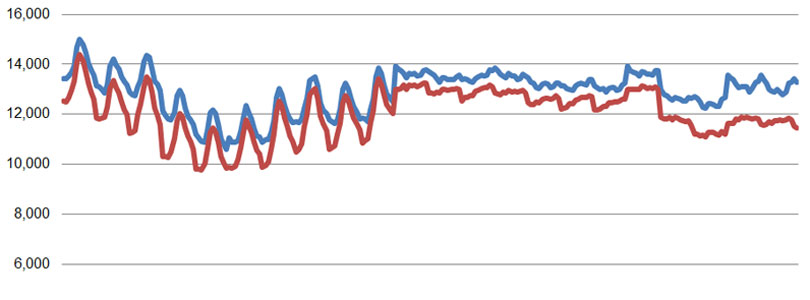
In the following chart, the number of unemployed residents is indicated by the distance between the two lines. Some caution is advised, when reviewing this data, because the jagged lines for the first half suggest that something is askew. All of the data is supposed to be not seasonally adjusted, but these lines give the impression that the methodology changed toward the end of the last century. The Current is looking into the discrepancy.

Note on the Data
The population data above comes from the U.S. Census conducted every ten years and is therefore generally considered reliable, to the extent that is used as reference for various government programs and voter districting.
The labor force and unemployment data, however, derives from the New England City and Town Areas (NECTAS) segment of the Local Area Unemployment Statistics (LAUS) of the federal Bureau of Labor Statistics (BLS). A detailed summary of the methodology is not readily available, but in basic terms, it is a model based on and benchmarked to several public surveys. It can be assumed that the sample rate (i.e., the number of people actually surveyed) in each Rhode Island town is very small (averaging roughly 30 people per municipality).
The trends shown, it must be emphasized, are most appropriately seen as trends in the model that generally relate to what’s actually happening among the population but are not an immediate reflection of it. Taking action on the assumption that the exact number of employed or unemployed residents shown corresponds directly to real people in a town would vest much too much confidence in the model’s accuracy.
Be that as it may, the data has been collected and published, and taken a town at a time, it is relatively easy to digest. So, curiosity leads the Current to see it as the best available data to deepen our understanding of trends within Rhode Island. If the findings comport with readers’ sense of how the towns relate to each other, perhaps lessons regarding local and statewide policies may be drawn. If not, then the lesson will be on the limitations of data in our era of information overload.