State in Decline, Employment in RI Cities and Towns: Warwick
Where Warwick stands out in the Rhode Island employment picture is not with its unemployment rate. The city’s 10.1% is lower than the state’s 11.8% overall (both percentages not seasonally adjusted). What stands out is the 7.2% drop in number of employed residents from 2000 to 2010. (The number has fallen by more than 1,000 since.)
Warwick’s population fell by 3,136 people, or 3.7% during that time period. However, its total labor force stayed about the same (up 0.6%).

Since 2010, Warwick has continued its slide. Its total labor force has fallen by 1,461 from March of that year, with employed residents making up 693 of that. What percentage of those residents lost their jobs and left or maintained their employment (not necessarily in Warwick) and moved for other reasons cannot be determined from these numbers.
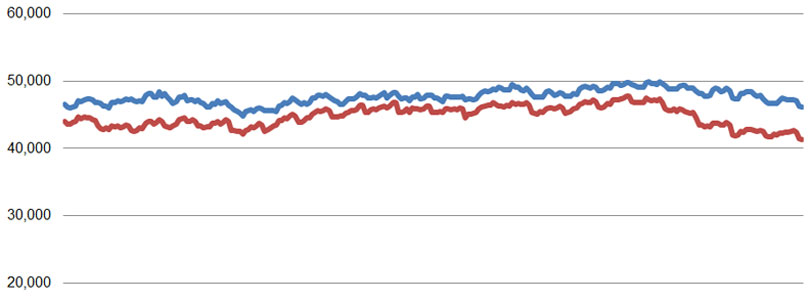
As the following chart shows, the number of employed Warwick residents has never been lower in the twenty-two years of data that the Department of Labor and Training provides. unemployment is the distance between the two lines.

Note on the Data
The population data above comes from the U.S. Census conducted every ten years and is therefore generally considered reliable, to the extent that is used as reference for various government programs and voter districting.
The labor force and unemployment data, however, derives from the New England City and Town Areas (NECTAS) segment of the Local Area Unemployment Statistics (LAUS) of the federal Bureau of Labor Statistics (BLS). A detailed summary of the methodology is not readily available, but in basic terms, it is a model based on and benchmarked to several public surveys. It can be assumed that the sample rate (i.e., the number of people actually surveyed) in each Rhode Island town is very small (averaging roughly 30 people per municipality).
The trends shown, it must be emphasized, are most appropriately seen as trends in the model that generally relate to what’s actually happening among the population but are not an immediate reflection of it. Taking action on the assumption that the exact number of employed or unemployed residents shown corresponds directly to real people in a town would vest much too much confidence in the model’s accuracy.
Be that as it may, the data has been collected and published, and taken a town at a time, it is relatively easy to digest. So, curiosity leads the Current to see it as the best available data to deepen our understanding of trends within Rhode Island. If the findings comport with readers’ sense of how the towns relate to each other, perhaps lessons regarding local and statewide policies may be drawn. If not, then the lesson will be on the limitations of data in our era of information overload.