Narrative Battles and Games with Models, 7/13/20 Data
The debate, and the data, around COVID-19 is starting to get interesting again. States that were harder hit earlier in the pandemic are claiming that they demonstrated leadership, versus states that weren’t hit as hard early on but are now seeing increases, even though the harder-hit states still have higher cases and death rates. Meanwhile, the debate, as presented in the news media, has fully shifted from the initial panic narrative that we had to shut everything down because we had no idea what the virus would do or how it worked to the current narrative, which strongly implies that martial-law-like policies should remain in place until the threat from the virus has completely gone away.
And then there is the complete silence around the idea that people can decide to balance this thread different, or to bring a different perspective to bear.
Some of this can be explained without recourse to political bias (although probably not all of it). The news media, for example, has incentive to maintain the impression that the virus continues to be a desperately important story that can’t be ignored for a single day. Thus, we get WPRI star reporter Ted Nesi tweeting that “the 10% increase in RI COVID hospitalizations since Friday (from 61 to 67) is something to keep a close eye on.” Nesi says this “adds context to Friday’s briefing where @GovRaimondo shared a forecast warning of the potential for hospitalizations to start rising again.”
Does that really “add context”? And if so, what is it really?
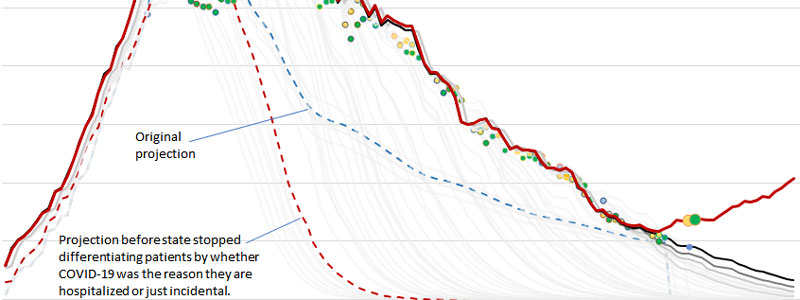
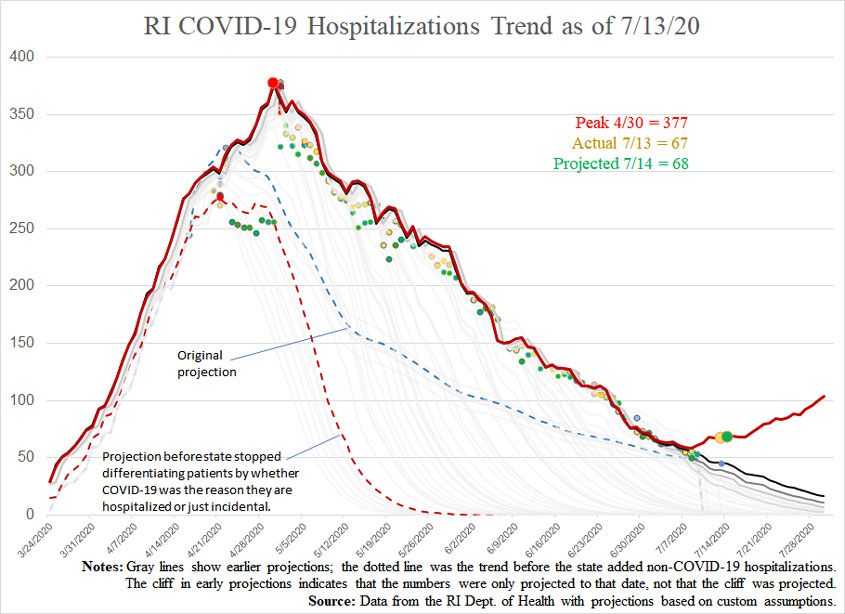
As you can see in my updated hospital projection chart, below, my model is now, indeed, predicting an increase that looks a lot like the projection from the governor in Nesi’s article, but I don’t make any assumptions at all about people’s future behavior. Rather, my model at this moment projects an increase for three reasons that may be nothing or may arguably be positive:
- The decrease in the rate of new infections over a 14-day span has edged up, from 0.035 to 0.039 over five days. That isn’t what we want to see, but it’s hardly terrifying. This means that the number of “active” cases, per my methodology, has increased, which is a part of my hospitalization projection. Looking more directly, we see that daily new cases have remained under 100 for four full weeks.
- The increase in hospitalizations is not because more people are being admitted to the hospital for COVID-19 than before. It isn’t even because more people are being admitted to the hospital with COVID-19 (whatever reason they’re in the hospital) each day. Those numbers have remained consistently below 10 for nearly three weeks. Rather, the increase in hospitalizations results from the facts that (a) fewer people with COVID-19 are being discharged from the hospital each day (probably because they’re in the hospital for something else) and (b) COVID-positive deaths in the hospital have mostly been at none or one per day. Last week, only four patients with COVID died; if the four days that had zero deaths had each had one, there would obviously be four fewer in the hospital.
- The numbers are relatively small, so a percentage increase over a few days can extrapolate to exaggerated increases later.
In summary, if we see an increase in hospitalizations, it may very well be an indication that fewer people are dying, which is good, and that people are in the hospital for other reasons, which isn’t an indication that COVID is overwhelming our resources.
Part of what makes human beings special is our ability to, in a sense, live in the future. We envision a future and begin to react intellectually and emotionally as if we are already living in that moment. This makes it a matter of grave importance to be sure that our future projections are accurate and that we know what they actually reflect. Fomenting a vision of harmful trends may encourage people to pay closer attention to the news, but it will also lead them to respond in ways that aren’t justified.
(See here for my original methodology and here for a subsequent modification I made. A thorough explanation of the chart is included in this post.)
Projections versus actuals (date of report).
- Cases:
- Projection for 7/13 (from 7/8): 17,360
- Actual for 7/13: 17,487
- Projection for 7/14: 17,538
- Hospitalizations:
- Projection for 7/13 (from 7/8): 46
- Actual for 7/13: 67
- Projection for 7/14: 68
- Deaths:
- Projection for 7/13 (from 7/8): 980
- Actual for 7/13: 984
- Projection for 7/14: 987