April Employment, the Slog and the Skepticism
The past week of scandals makes skepticism of government employment data a bit more reasonable. Communications related to Benghazi suggest a federal administration, with emphasis on the State Department, preparing to deceive the public on a matter of international security shortly before an election. Over the past couple of years, the IRS slow-rolled and intimidated Tea Party and other conservative groups, and apparently pushed revelation of the scandal until after the election. Mix in the Department of Justice’s wide-netted drag of Associated Press phone records.
In the context of these examples of multiple Obama Administration departments’ malfeasance, noting the curious pattern of revisions made to employment data by the U.S. Bureau of Labor Statistics in the Dept. of Labor seems a bit less conspiratorial. By the way, Secretary of Labor Hilda Solis resigned suddenly in January, after a controversial time in office and before the revisions were released.
All that said, the numbers that the federal government provides are by far the most comprehensive available, and even suspicious vacillations of the data involve minor discrepancies for most purposes.
The Rhode Island headline for the April data is that the unemployment rate has fallen to 8.8%. As Kate Bramson’s Providence Journal article today notes, a significant portion of the “improvement” can be explained by the fact that many fewer Rhode Islanders are actually looking for work. Bramson later tweeted that Rhode Island now has the sixth highest unemployment rate, which actually feels like an improvement after years spent hovering in the top three.
There are complications, though. First, looking at the broadest BLS measurement of employment, which includes those who’ve given up looking for work recently as well as those who aren’t able to work as many hours as they’d like brings Rhode Island’s rate up to 16.7%, the fourth worst in the nation. Looking at hours worked, people working in Rhode Island are actually working fewer hours, on average, than they were a year ago. And the two states with which Rhode Island shared the bottom 3 for so long have generally been seeing more people looking for work, not fewer, as in the Ocean State.
The following chart shows how stagnant employment numbers and a falling labor force (those working plus looking for work) is leading to a lower unemployment rate — because the rate is nothing but the gap between the two lines.

Putting our neighbors on the chart (as a percentage of January 2007 labor force) shows that the only silver lining is that Connecticut’s precipitous decline (after the end of some federal spending and the substantial increase in taxes) makes Rhode Island’s stagnation look relatively positive.

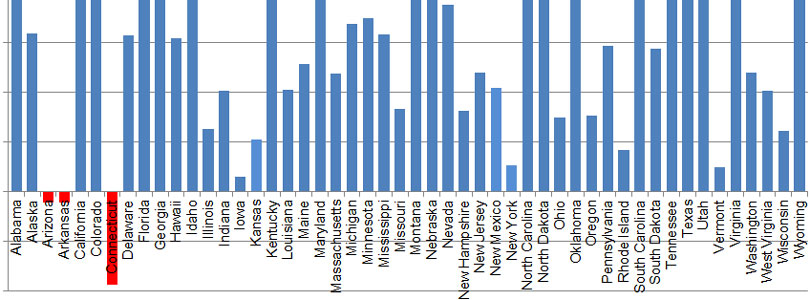
On a national level, Rhode Island remains the second-farthest state from its employment peak. It isn’t surprising, based on the previous charts, that the Ocean State’s placement on this chart has remained pretty stationary.

The same is true of employment growth since the employment recession’s end in 2010. Connecticut captures the spotlight on this chart, as the state most rapidly falling away from its level when the nationwide recession had decisively ended.

