January 2017 Employment: Job Slowdown, New Pre-Revision Blip
As already noted in this space, the annual revision of the Bureau of Labor Statistics (BLS) caused a significant amount of Rhode Island’s apparent employment simply to disappear. Consequently, even though employment and labor force were up in January, both numbers remained below their previously reported levels. Something similar happened with the data for RI-based jobs, which were reported to be up by 1,400 in January, but only after the annual revision had taken 800 off the top.
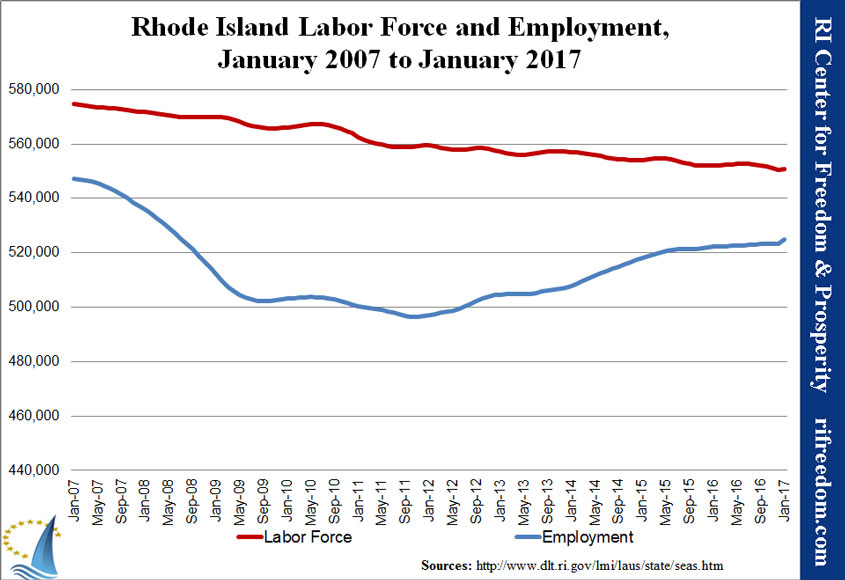
The first chart shows that labor force (red line) and employment (blue line), which indicates the number of Rhode Islanders working, wherever or however much they work, both blipped up in January. Such bumps in a new year aren’t unusual, having become an annual game of quick gains later to be revised away. The disconcerting story remains, however, a long falling away of people looking for work and essential stagnation since the month that Governor Raimondo signed her first budget in June 2015.
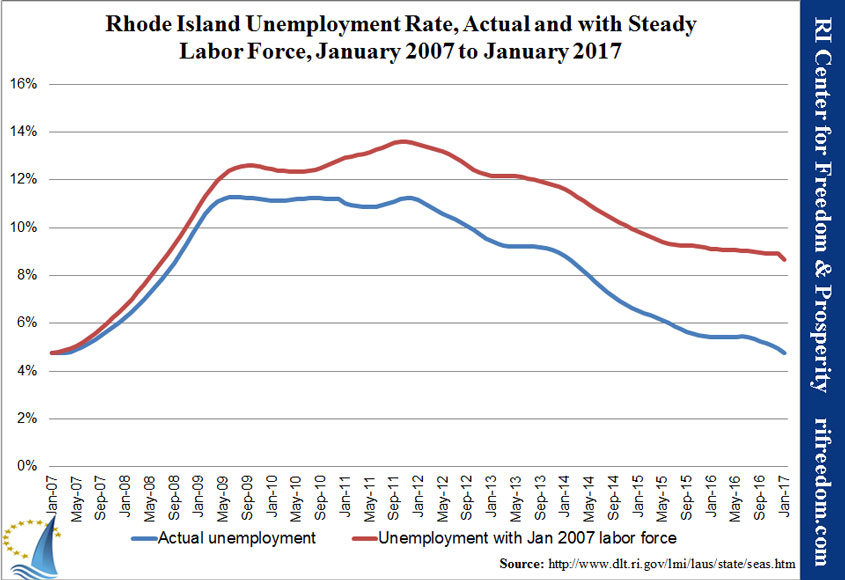
The blip is also visible in a chart of the unemployment rate (blue) compared with what the unemployment rate would have been if Rhode Islanders hadn’t stopped looking for work. The state’s 8.7% unemployment rate in the latter case is another way of illustrating how misleading it is of Governor Raimondo to tout the fact that the state’s unemployment rate has technically fallen below that of the nation as a whole.
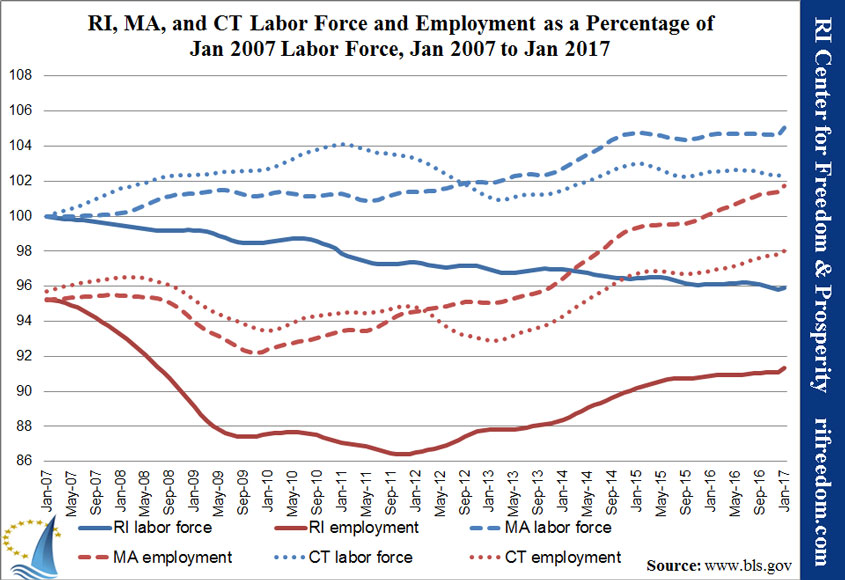
A comparison with Massachusetts and Connecticut shows that the former experienced its own January bump. Whatever the case, the gap between Rhode Island and the two states that surround it is huge.
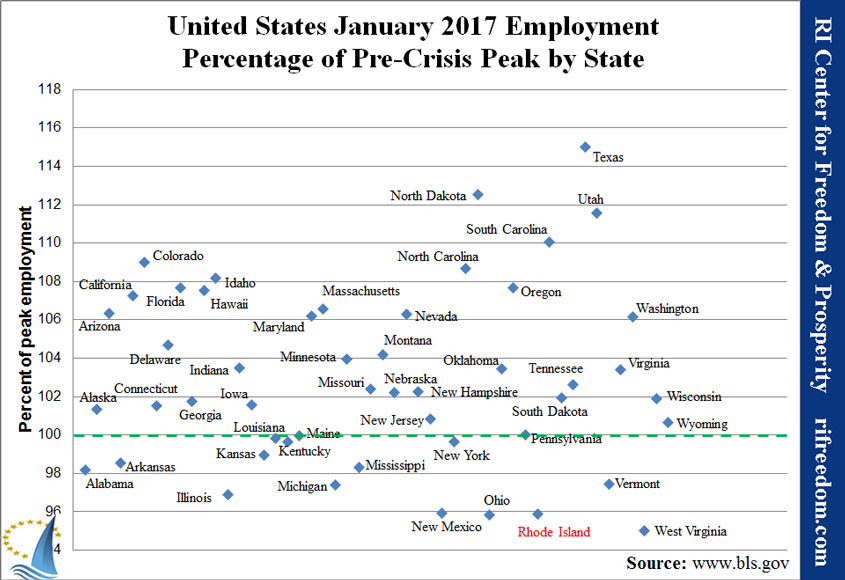
Regarding Rhode Island’s distance from its employment peak, the revision set Rhode Island back a bit (not made up with the January blip), but the bigger benefit for the Ocean State came from the fact that Ohio and West Virginia slipped more than we did among our company in the bottom four states.
The revision also brought more sense to our chart showing employment and RI-based jobs together. As stated above, employment has been pretty much stagnant for nearly a year. Now RI-based jobs are closer to stagnant, rather than merely slow growth, up an average of 0.08% each month since June 2015.

Our final chart each month shows Rhode Island’s standing among New England states in the race of the RI Center for Freedom & Prosperity’s Jobs & Opportunity Index (JOI). This index takes into account 13 data points covering factors involved in employment as well as welfare enrollment, taxes, and income. Notable this month is that enrollment in both Medicaid and SNAP (food stamp) is up, perhaps reflecting the ability of the UHIP program to transfer enrollment in one welfare program to enrollment in others. If the effect of UHIP (once it’s working properly) is to give Rhode Island an “advantage” in doling out public money, the Ocean State will be fortunate if it can even hold its 48th national ranking on JOI.

