January 2015 Employment: Still Not a Recovery Story
The Rhode Island Department of Labor and Training might as well have put a smiley face on its latest press release about Rhode Island employment. In fact, the department so wanted to emphasize improvement in unemployment that it repeated historical comparisons in two ways:
- “This is the lowest unemployment rate since February 2008.”
- “This represents the lowest employment level since December 2007.”
The first is the 6.5% unemployment rate, and the second is the 33,700 count of unemployed Rhode Islanders. Not emphasized, however, is that the state’s labor force — those employed or looking for work — is at its lowest count since May 2002. At that time, the unemployment rate was 4.9%, which means more Rhode Islanders were employed. The following chart shows the labor force and number of employed residents since the beginning of the recession.
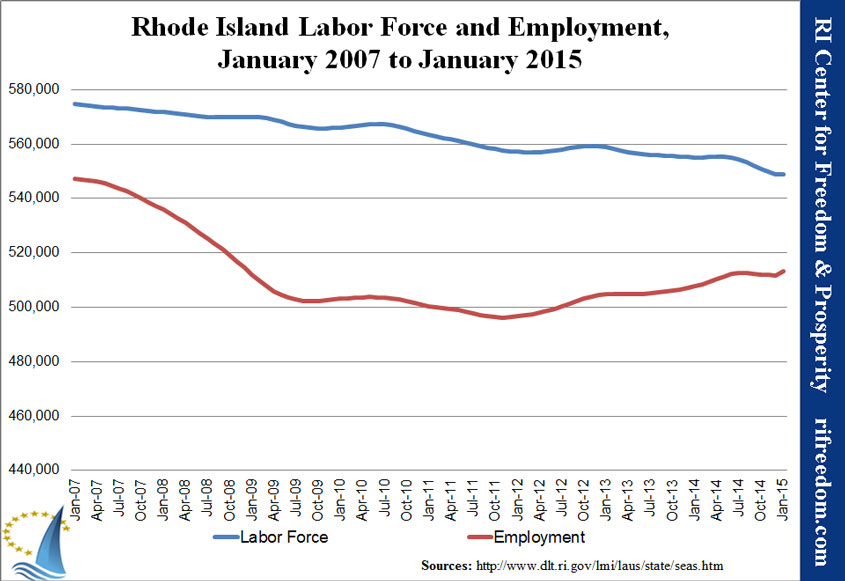
If 1,492 more people pull out, Rhode Island’s labor force will be smaller than the state’s employment at its peak. In other words, Rhode Island’s unemployment recovery essentially entails getting everybody who was unemployed at the state’s peak to give up looking for work.
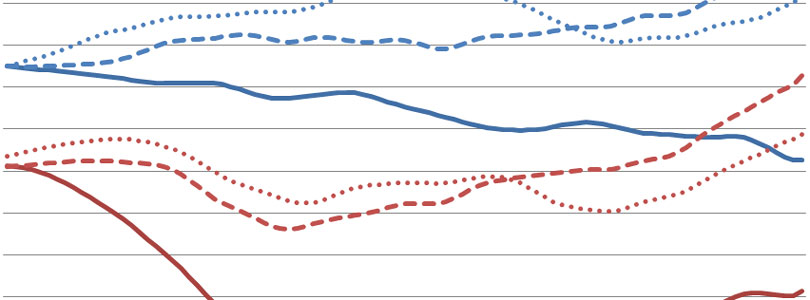
If those lines aren’t discouraging enough, put them in the context of the Ocean State’s neighbors. Both Massachusetts and Connecticut have their highest levels of labor force and employment ever. In stark contrast to Rhode Island, Massachusetts almost has as many residents employed as were employed or unemployed in January 2007.

If anything, a broader perspective is worse. The revision that the Bureau of Labor Statistics (BLS) released a few weeks ago knocked Rhode Island a bit farther from its peak, but the January data increases the impression that the state is a woeful outlier. The only states as far from their peak employment are Michigan, which has been improving over the past couple of years, and West Virginia, which is West Virginia. [Note: This chart is missing Mississippi, which fell off the bottom of the chart with the revision. See the February post for more information.]

Finally, the chart combining Rhode Island’s level of employment with the number of jobs based in the state puts the one-month gains in perspective. The absolute best that can be said is that the Ocean State is managing to grow more slowly than inflation.
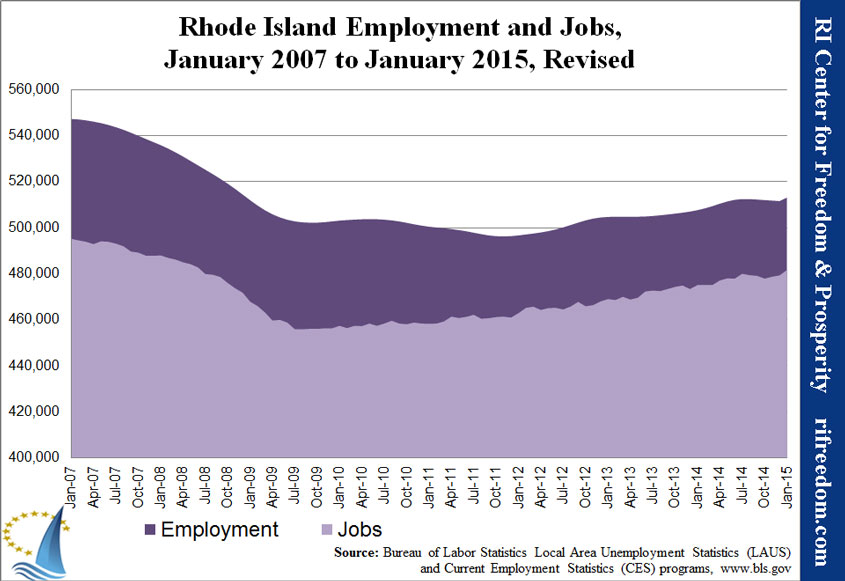
Put that final chart in the context of the second one, above, and a striking contrast emerges. Despite the rapid growth of employment in our neighboring states, the number of jobs based in Rhode Island is slightly outpacing the increase in the number of Rhode Islanders working. In other words, Rhode Islanders aren’t proportionally finding work in either Massachusetts and Connecticut.
It would be guessing to speculate about what that indicates, but none of the possibilities are especially good for Rhode Island.
