State in Decline, Employment in RI Cities and Towns: North Providence
With a not-seasonally-adjusted unemployment rate of 10.5%, North Providence is well ahead of Rhode Island, with its overall rate of 11.8%. Long-term trends, however, suggest that the reason isn’t as encouraging as it might be.
Over the first decade of the century, North Providence lost 1.0% of its population. And although its labor force (the total number of people working or looking for work) increased 3.3%, the city’s number of employed residents fell 4.7% across the decade.

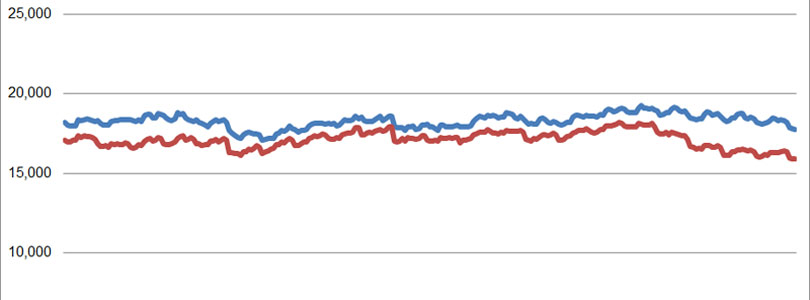
As the following chart illustrates, the number of employed residents of North Providence has never been lower across the twenty-two years of Dept. of Labor and Training data. As far as its unemployment rate is concerned, North Providence has benefited by the fact that it did not share the rapid growth in labor force that many other RI cities and towns shared.
In the following graph, unemployment is visible as the distance between the two lines.

Note on the Data
The population data above comes from the U.S. Census conducted every ten years and is therefore generally considered reliable, to the extent that is used as reference for various government programs and voter districting.
The labor force and unemployment data, however, derives from the New England City and Town Areas (NECTAS) segment of the Local Area Unemployment Statistics (LAUS) of the federal Bureau of Labor Statistics (BLS). A detailed summary of the methodology is not readily available, but in basic terms, it is a model based on and benchmarked to several public surveys. It can be assumed that the sample rate (i.e., the number of people actually surveyed) in each Rhode Island town is very small (averaging roughly 30 people per municipality).
The trends shown, it must be emphasized, are most appropriately seen as trends in the model that generally relate to what’s actually happening among the population but are not an immediate reflection of it. Taking action on the assumption that the exact number of employed or unemployed residents shown corresponds directly to real people in a town would vest much too much confidence in the model’s accuracy.
Be that as it may, the data has been collected and published, and taken a town at a time, it is relatively easy to digest. So, curiosity leads the Current to see it as the best available data to deepen our understanding of trends within Rhode Island. If the findings comport with readers’ sense of how the towns relate to each other, perhaps lessons regarding local and statewide policies may be drawn. If not, then the lesson will be on the limitations of data in our era of information overload.

