State in Decline, Employment in RI Cities and Towns: Coventry
Although, at 11.2%, Coventry’s unemployment rate isn’t far from Rhode Island’s 11.8% (neither seasonally adjusted), the explanation isn’t quite as discouraging as that fact might make it seem. Based on data provided by the Rhode Island Department of Labor and Training, Coventry’s issue appears to be that its labor force has been growing more quickly than its population or resident employment.

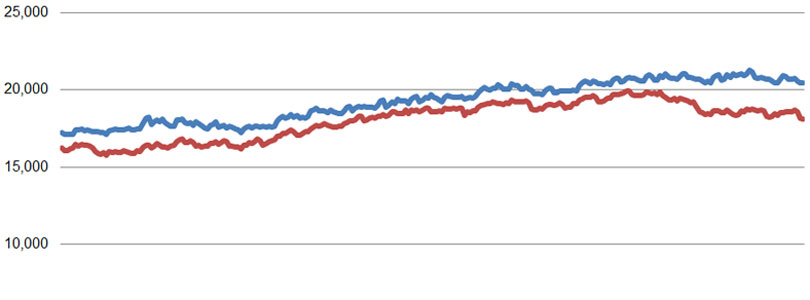
As the chart shows, Coventry’s population grew 4.0%, from 2000 to 2010, and its labor force grew 8.2%. Therefore, with its number of employed residents holding virtually steady from one point to the other, its unemployment rate went from 3.9% to 11.6% over those ten years.
The data suggests two broad dynamics. First, people already living in Coventry have been entering the job market and unable to find work, whether they are spouses looking for supplemental income, children reaching adulthood and remaining (unemployed) in town, or some other possibility. Second (and about six times more significant), people are moving to Coventry without increasing the total number of residents who are employed, whether they, themselves, are unemployed or are offsetting Coventry natives who’ve lost their jobs.
As a consequence, the total number of residents who count as unemployed, signified by the gap between the two lines on the following chart, tripled over those ten years and doubled from 1990 to March 2012.

Note on the Data
The population data above comes from the U.S. Census conducted every ten years and is therefore generally considered reliable, to the extent that is used as reference for various government programs and voter districting.
The labor force and unemployment data, however, derives from the New England City and Town Areas (NECTAS) segment of the Local Area Unemployment Statistics (LAUS) of the federal Bureau of Labor Statistics (BLS). A detailed summary of the methodology is not readily available, but in basic terms, it is a model based on and benchmarked to several public surveys. It can be assumed that the sample rate (i.e., the number of people actually surveyed) in each Rhode Island town is very small (averaging roughly 30 people per municipality).
The trends shown, it must be emphasized, are most appropriately seen as trends in the model that generally relate to what’s actually happening among the population but are not an immediate reflection of it. Taking action on the assumption that the exact number of employed or unemployed residents shown corresponds directly to real people in a town would vest much too much confidence in the model’s accuracy.
Be that as it may, the data has been collected and published, and taken a town at a time, it is relatively easy to digest. So, curiosity leads the Current to see it as the best available data to deepen our understanding of trends within Rhode Island. If the findings comport with readers’ sense of how the towns relate to each other, perhaps lessons regarding local and statewide policies may be drawn. If not, then the lesson will be on the limitations of data in our era of information overload.