March Employment in Rhode Island: How Worlds Diverge
Watching the employment statistics, as presented by the federal Bureau of Labor Statistics (BLS) from month to month, offers an interesting perspective on how people can develop different understandings of objective reality.
Tracing the unemployment rate, one might think Rhode Island is undergoing a strong recovery. In January 2010, it was 11.9%, and for years the state was among the worst three, periodically claiming the lead spot. This past March, though, the rate was 9.1%, which puts five other states in a worse position.
But viewing the statistics in terms of employment, not unemployment, changes the picture entirely. That fact is most starkly seen in comparison with the worst two states for unemployment, California and Nevada, with which Rhode Island shared the bottom three for so many months: Both of them added employment from February to March, while the Ocean State lost employment. Yet, they’re still at the bottom for unemployment, while Rhode Island is moving away from it.
The difference is that many more people have decided to look for work in those Western states, while the story of Rhode Island is one of people giving up.
The evidence is also visible in the following chart, particularly in the line for labor force. That’s the number of people who say that they are either employed or looking for work. The sharp decline is the entire reason for the ostensible improvement of the unemployment rate.

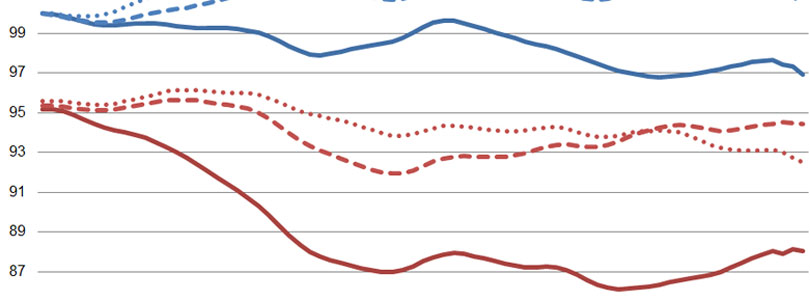
Putting Rhode Island in the context of its two neighbors doesn’t improve the image. The following chart shows labor force and employment as a percentage of its level during January 2007.

The picture bringing in national context is notable mainly because it doesn’t show much difference for Rhode Island. The state is still the second farthest from its peak employment… although Michigan has begun to close the gap. Unless Rhode Island does something drastic, it will be an interesting experiment to watch what happens to the other two states in the bottom three by comparison; both enacted right-to-work legislation last year.

Meanwhile, a chart showing each state’s distance from its employment level from February 2010 (when the jobs decline had pretty clearly ended nationwide) is notable for the fact that the number of states in the red actually increased, with the addition of Arkansas.

