January 2019 Employment: Pain of a Revision and a Bad Economy
After a major revision of the data from the Bureau of Labor Statistics (BLS), Rhode Island, not only are employment, labor force, and jobs significantly lower than had previously been reported, but all sense of momentum has been proven illusory.
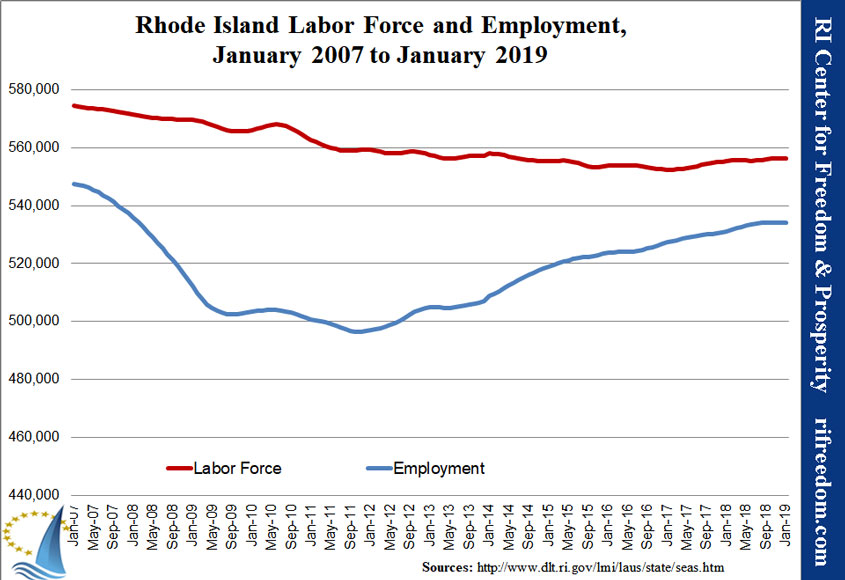
In the following chart, the red line shows the labor force (people working or looking for work) and the blue line shows employment since the start of the Great Recession. Even before the revision, things looked to be cooling in the Ocean State, but the revision shows precious little improvement for the entire time Democrat Governor Gina Raimondo has been in office, with a flat line for the second half of last year.
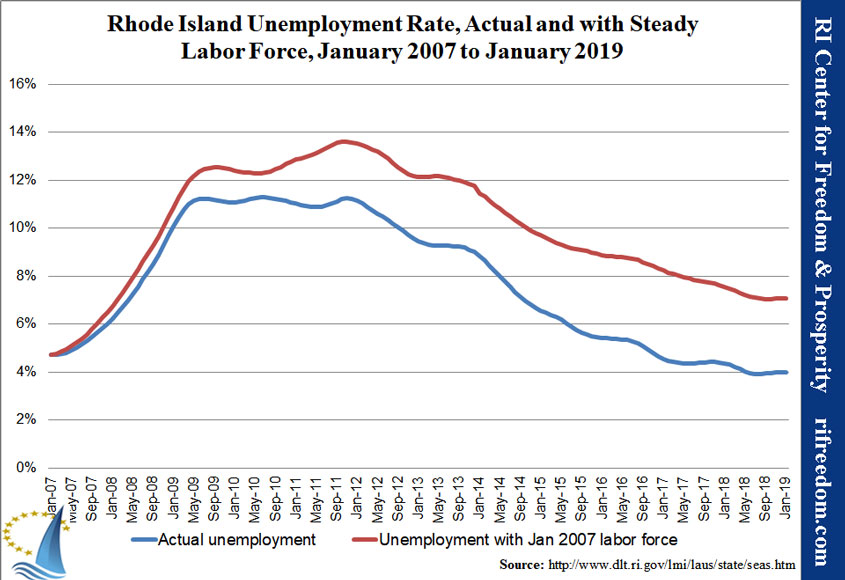
For those who suggest that, even with the revision, Rhode Island’s unemployment rate is still a healthy 4%, we offer the following chart. The blue line shows the actual unemployment rate, while the red line shows what it would be if so many residents hadn’t stopped looking for work over the last decade. Instead of a 4.0% unemployment rate, we’d still be at 7.1%.
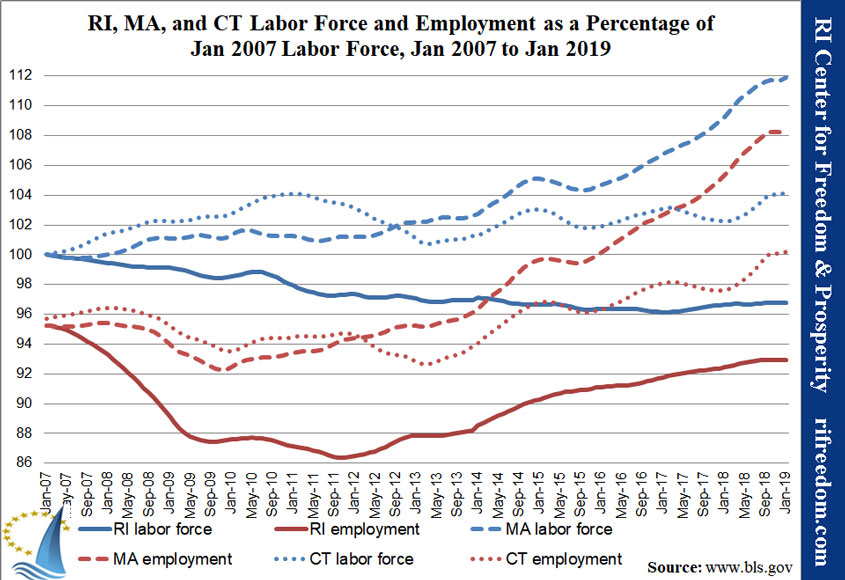
Anybody looking for comfort in this month’s report will have to find it in the next chart. This shows Rhode Island’s employment and labor force trends against those of Massachusetts and Connecticut, and while the Ocean State is still flat and the worst of the three, at least the other two states have seen some flattening in recent months, suggesting that it wasn’t entirely limited to us. However, the slight uptick for Massachusetts in January cautions against making too much of the shared pause.
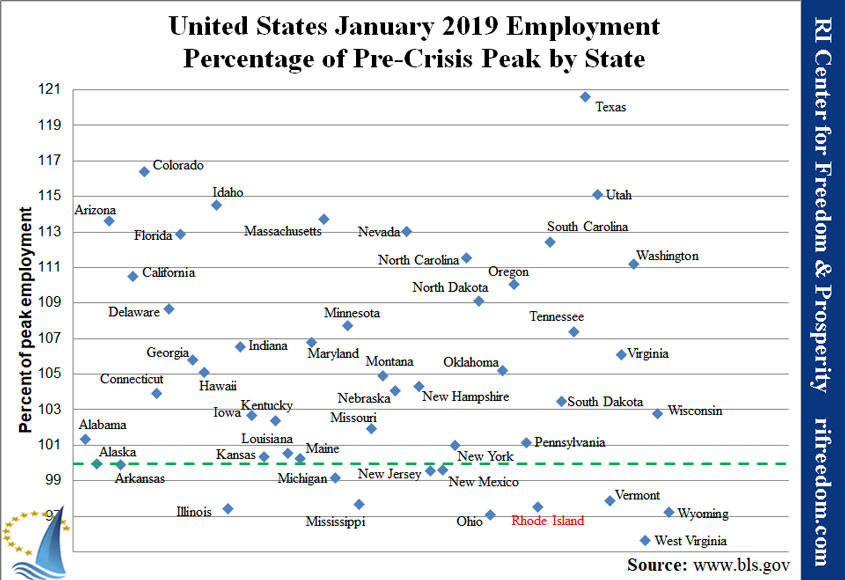
A national comparison doesn’t leave much to be excited about either. When it comes to regaining lost employment from the recession, Rhode Island is in the bottom five and one of only 11 states that haven’t yet at least hit their previous peaks.
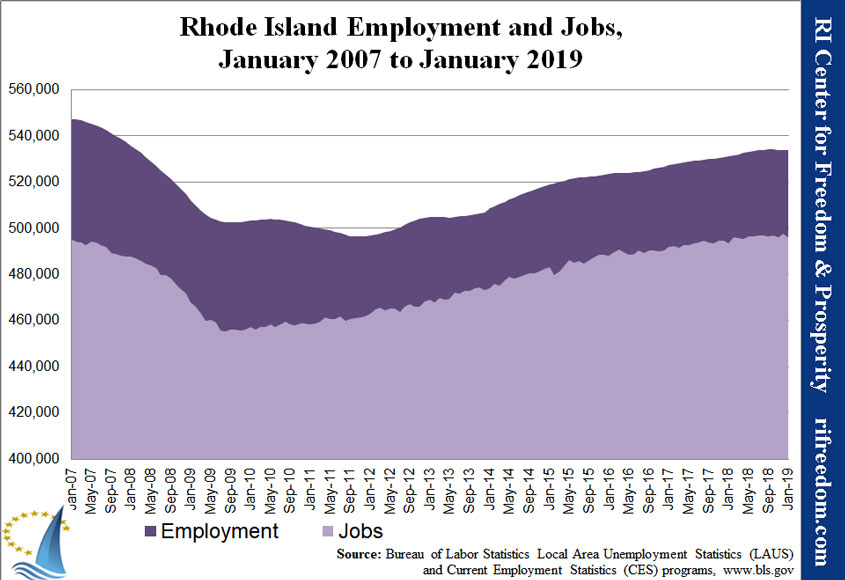
Perhaps the biggest hit of the recession came with the data concerning jobs that are based in the state — the lighter area of the chart below. Until the revision, one could say that Rhode Island had at least seen continued (albeit slow) increases, here. Now the story of the past few years is an even more dramatic slowing than was previously the case.
[box type=”tick” style=”rounded”]Please consider a voluntary, tax-deductible subscription to keep the Current growing and free.[/box]
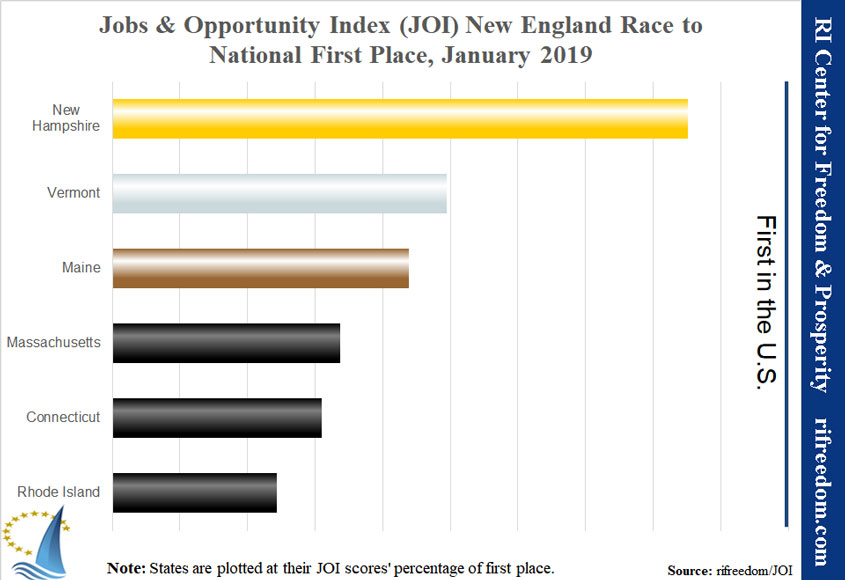
The last chart for this monthly report shows New England states’ positions on the Rhode Island Center for Freedom & Prosperity’s Jobs & Opportunity Index (JOI). JOI takes into account 12 data points, including these employment and jobs numbers as well as income, taxes, and welfare, and it finds Rhode Island to be 47th in the country.
[metaslider id=32396]